The full 2021 State of the Industry report will be available for purchase later this year at the IFAI e-store, www.IFAI.com/estore. The full report takes a deep dive into business types and market segments.
Introduction to the research
This research highlights findings from more than 300 members of the industrial fabrics community who shared information about their organizations with us (Fig. 1). The information was gathered through an online survey fielded January–March 2021 that asked organizations about their businesses pre-pandemic (2019) and during the pandemic (2020), as well as their outlook for the future. The research also takes a deeper look at organizations by their primary business type and the markets they serve.
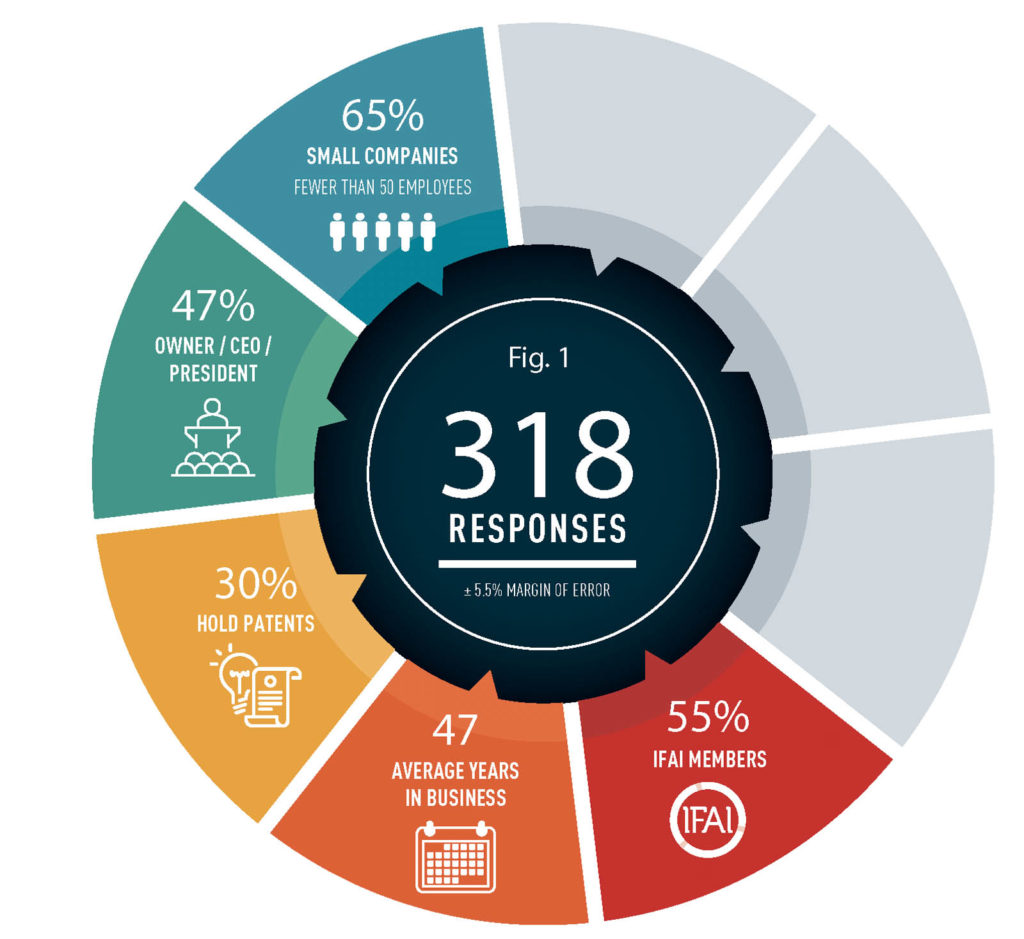
Reliable research starts with targeting the right audiences. Strict screening criteria ensured that the sample was representative of the industry. Survey participants were recruited by IFAI using a wide array of industry resources including direct email contact, social media and word of mouth to ensure as much participation as possible. The following are key characteristics of the respondent pool:
- All consider themselves part of the industrial fabrics community and all participate as for-profit entities supplying products and/or services (associations, media and government entities were excluded).
- Respondents are leaders in their organizations: 47% are owners/presidents/CEOs; 13% are vice presidents/principals; and 15% are directors/managers.
- More than half are members of IFAI, with Professional Awning Manufacturers Association (PAMA) and Marine Fabricators Association (MFA) being the most represented divisions among survey respondents.
- For the purposes of this report, “industrial fabrics” is defined as “the sale, resale, and/or production of industrial fabrics, advanced textiles, specialty fabrics and/or rolled goods (for example, vinyl, geosynthetics, etc.) and associated equipment/hardware/software.”
The margin of error indicates the confidence level in the data (at the 95% level). As the margin of error increases, confidence decreases. Given the sample size of 318, this study has a margin of error of 5.5%, which is in line with most consumer and presidential polls.
2021 industry outlook
To be sure, 2020 was a year of dramatic changes and a “new normal” brought on by the global pandemic beginning in March 2020. The rapid shutdown of the economy and subsequent reopening with restrictions (among other factors) led to a decrease of U.S. real gross domestic product (GDP) of 3.5% (following an increase of 2.2% in 2019)1.
1. https://www.bea.gov/news/2021/gross-domestic-product-4th-quarter-and-year-2020-advance-estimate.
Most organizations in the industry have encountered downturns in the past. In fact, the oldest responding company opened its doors in 1830, and 9% of organizations can boast more than 100 years of experience. On average, organizations have been in business for 47 years, surviving through this pandemic, 2008’s Great Recession and the threats faced by 9/11. Most were able to maintain the prior year’s revenues and are riding out the pandemic as the economy begins to turn around.
As of this writing, the U.S. economic outlook is positive: GDP began increasing in the third and fourth quarters of 2020. Most predictions are for a robust recovery in 2021, with U.S. real GDP expected to increase upwards of 6%2 , driven largely by stimulus spending.
2. https://www.conference-board.org/research/us-forecast; https://www.businessinsider.com/economic-forecast-gdp-biden-stimulus-reopening-consumer-spending-inflation-ubs-2021-3.
It is encouraging to know that, collectively, companies in the industry also have positive expectations for their future. Some 62% expect their revenues to increase while only 5% expect a decrease (one-third are not sure).
Overall, respondents expect an average increase of 8.5% in annual revenues over the next two years. Organizations serving the hospitality markets anticipate the highest increase in revenues (10%). Those serving manufacturing and agriculture anticipate slightly lower-than-average revenues.
Industry composition
Nearly half of industry participants (46%) classify their primary business type as end product manufacturer/fabricator (Fig. 2). End product manufacturers/fabricators produce everything from awnings, canopies and boat covers to medical safety equipment, automobile interiors, custom apparel and costumes, and safety netting.
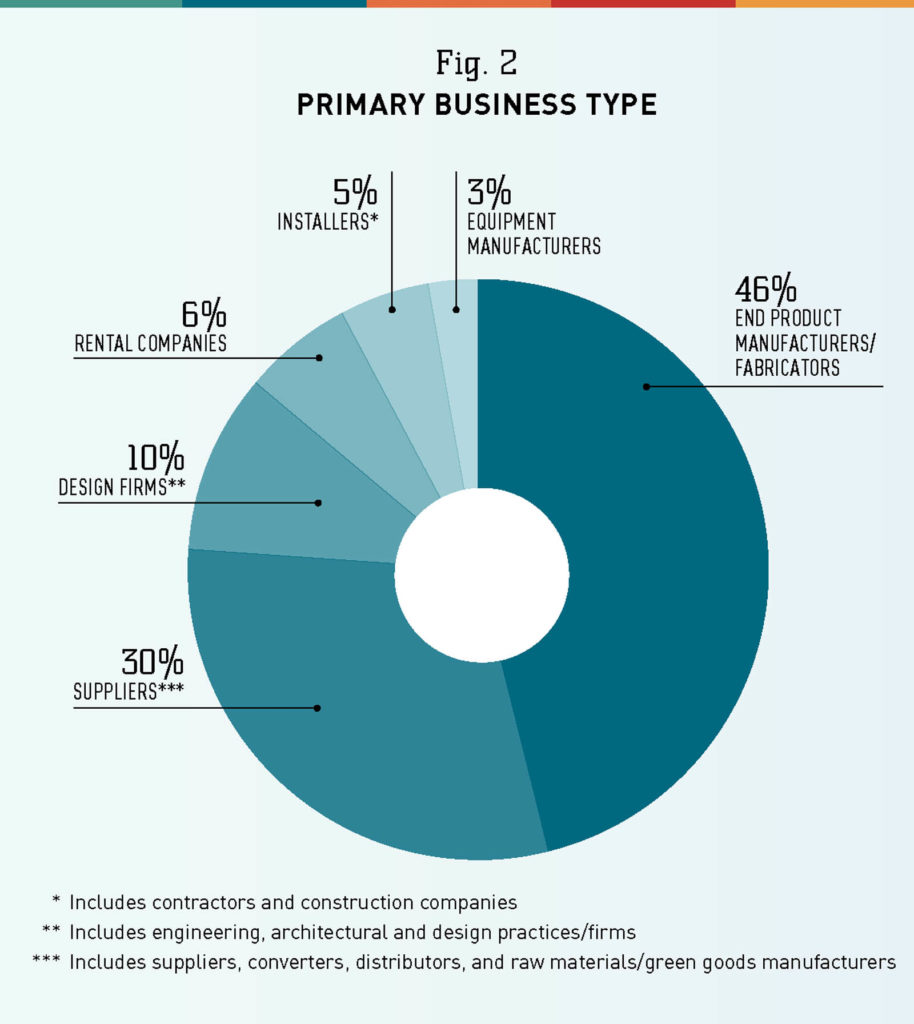
Those providing inputs (referred to as “suppliers” throughout this report) comprise 30% of the industry and include suppliers (12%), distributers (8%), raw materials/green goods manufacturers (6%) and converters (4%).
One in 10 businesses is an engineering, architectural or design firm/practice (“design firm”).
Rental companies comprise 6% of respondents and include organizations in the event rental space. Installers/contractors/construction companies (“installers”) make up 5% of respondents, and 3% are equipment manufacturers.
Only one-fourth (26%) of businesses maintain multiple roles in the industry. Most of this overlap involves end product manufacturers. Nine percent of end product manufacturers are also suppliers and 9% are also installers. There is little overlap among other business types.
Most are small businesses. Ninety percent of organizations in the industry are categorized by the U.S. Small Business Administration as a “small business”—one with fewer than 500 employees. Comparatively, 99.9% of all businesses in the U.S. would be classified as small businesses (2018 data). Within the industry, one-third have fewer than 10 employees and only 6% have more than 1,000 employees.
Across all business types, the average revenue from industrial fabrics lines of business is $4.2M (a 4.5% decrease from $4.4M in 2019). The highest revenue is found among suppliers, which averaged $7.2M in 2020, followed by equipment manufacturers, which reported average revenues of $4.1M.
Products sold
Over time, organizations have grown and expanded to industries outside of industrial fabrics (or, conversely, started outside of the industry and grew into industrial fabrics) and increased product lines within their industrial fabrics portfolios.
Industrial fabrics are the main source of revenues for most organizations, providing 70% (on average) of revenues in 2020 and 69% of revenues in 2019. Most (69%), however, participate in industries outside of industrial fabrics. These industries range from apparel to metal fabrication to the more atypical photography and portable restrooms. Of the 31% that focus solely on the industrial fabrics industry, the majority are end product manufacturers.
Looking to the future, nearly one-quarter (23%) plan to develop products outside of the industrial fabrics industry as part of their business growth plans.
Currently, only 22% focus on a single product type; most often, these are design firms that sell services. On average, businesses produce five different types of the 30-plus product types named by survey respondents (Fig. 3). Some produce as many as 24 different product types.
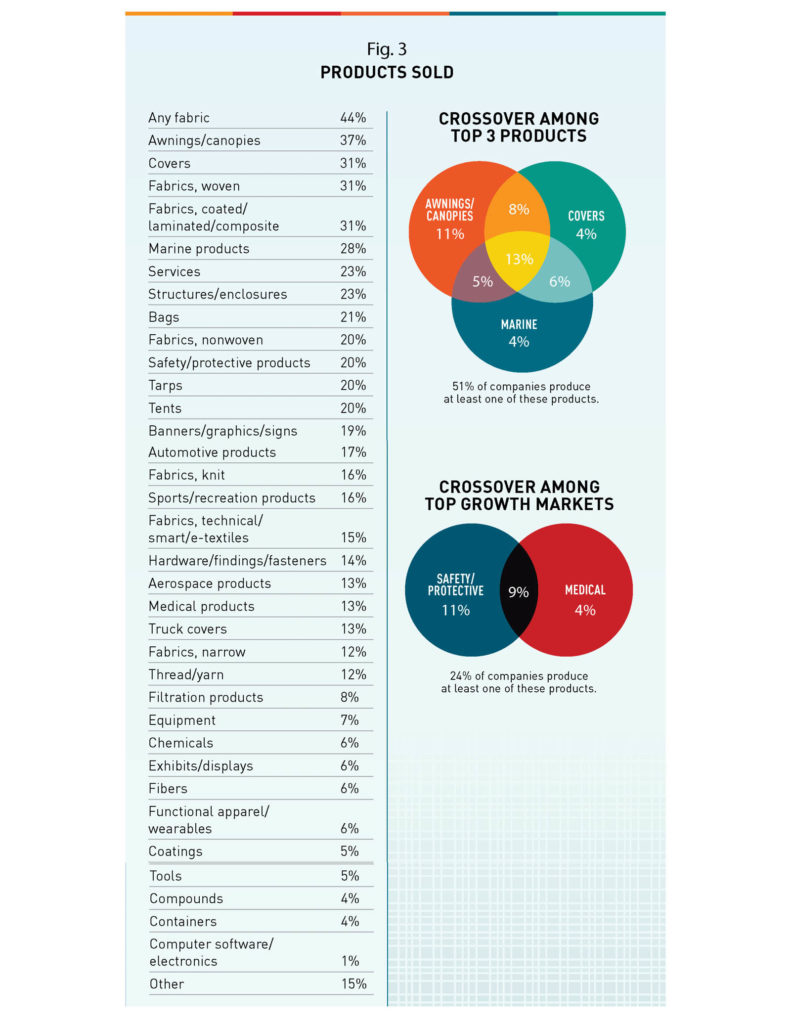
Nearly half of businesses sell fabrics (31% offer woven fabrics and/or coated/laminated/composite fabrics). Following fabrics, awnings/canopies and covers are the most frequently sold products, and 21% of businesses sell both awnings/canopies and covers. About one-quarter (23%) of businesses focus on services and 7% sell equipment.
Organizations in industrial fabrics have developed a variety of unique products and skill sets. One in three businesses is the exclusive supplier of a specific product, often built around a patent, unique design or licensing agreement. Some examples include patented fabrics and webbing, computer software, character costumes, inkjet pigments and a melt-out system. One in three also holds at least one patent; the average number of patents held is eight.
Target markets
Similar to product lines, few (12%) industrial fabrics businesses target only one market. The most common single market is the marine market. The average business targets six of the markets mentioned in Figure 4. Equipment manufacturers have the largest reach. Design/architectural firms maintain tighter targets (around four markets); most frequently these are commercial architecture/building/construction, infrastructure, and residential architecture/building/construction.
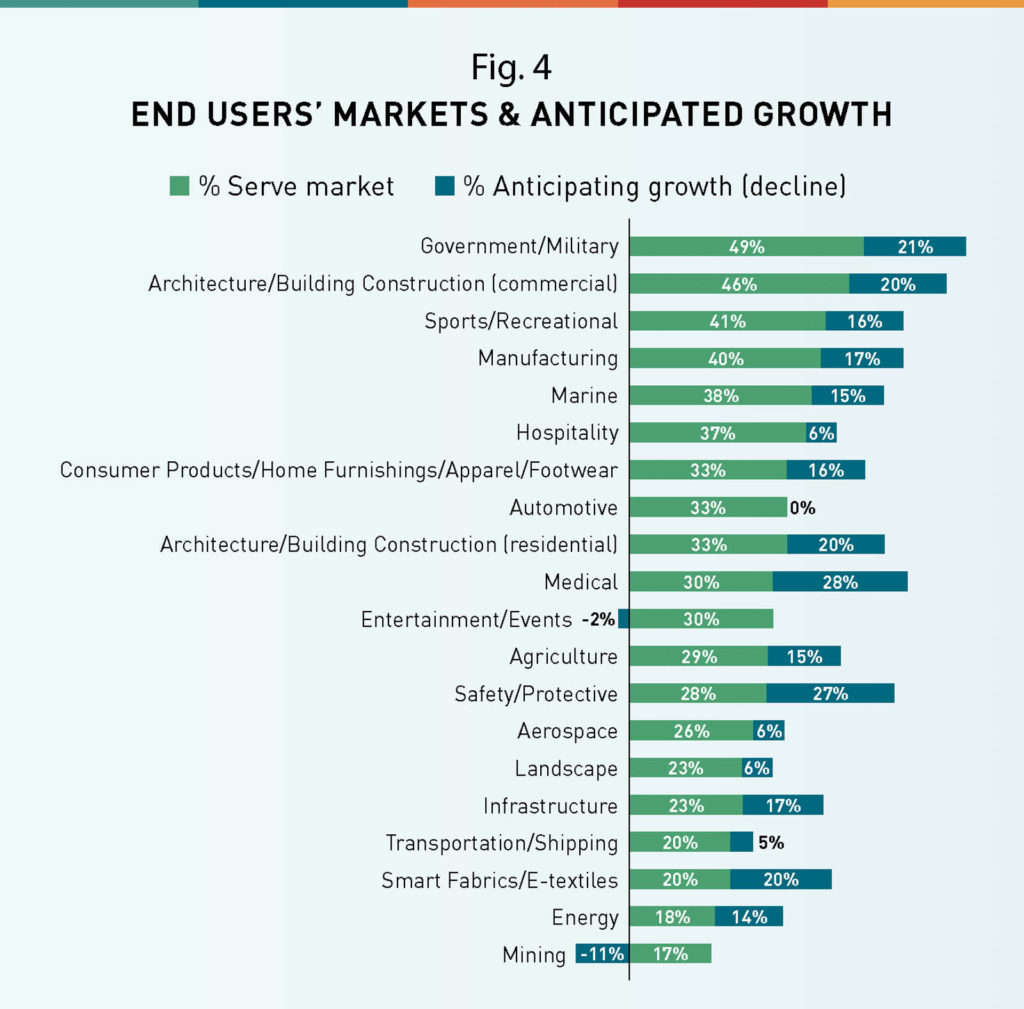
The government/military market is served most frequently (49% of organizations). Commercial architecture/building/construction is served by 46% of businesses, and 41% target the sports/recreation market. The manufacturing and marine markets round out the top five markets.
On average, each market contributed 5% to overall revenues in 2020, consistent with 2019 (Fig. 5).
Government/military contributed the highest revenue amount at 13%. Manufacturing provided 11% and commercial architecture/building/construction contributed 8% to overall revenues.
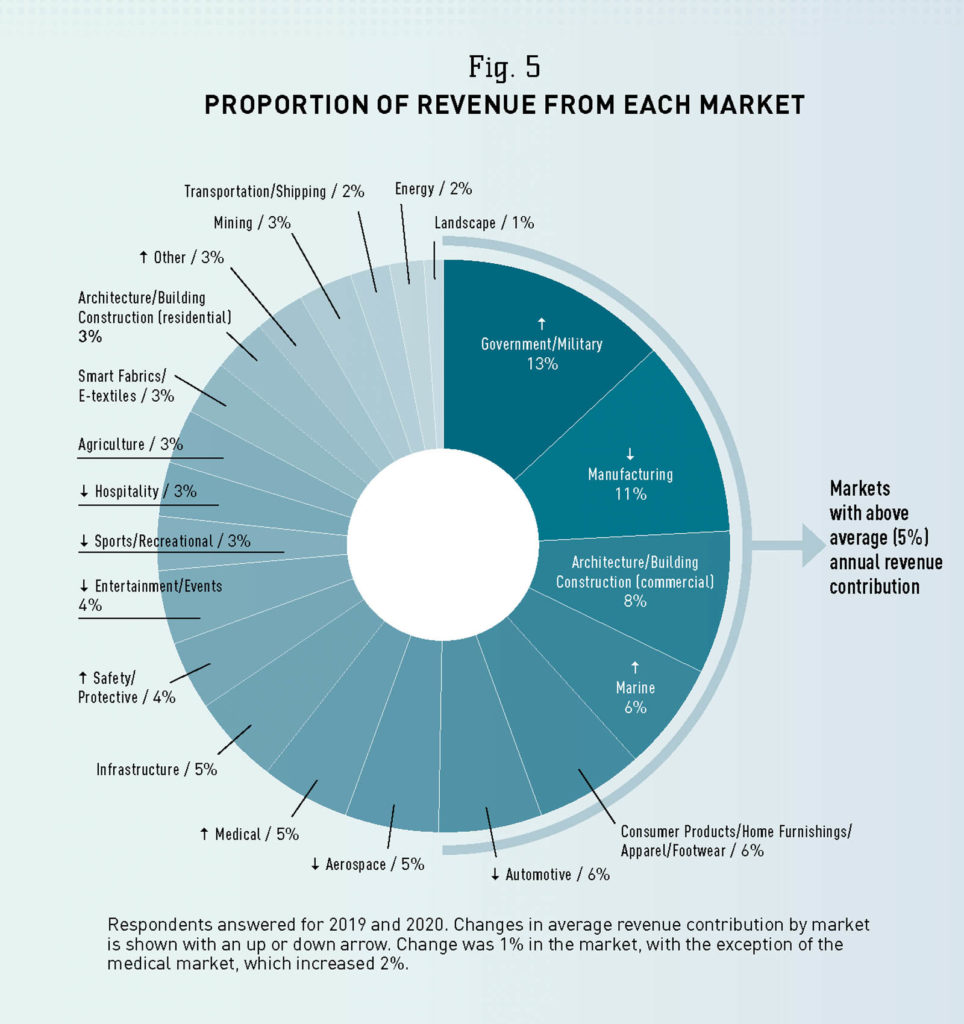
When asked about growth markets, more than one-quarter responded that the medical and safety/protective markets will grow in the next two years. Other markets where growth is expected are government/military, architecture/construction (commercial and residential) and smart fabrics. Mining and entertainment/events are markets in which more respondents expect a decline rather than growth.
More than half (56%) of organizations expect to enter new markets in the coming years. Look for increased competition in smart fabrics and manufacturing as well as energy, infrastructure and safety/protective markets. These are the top mentioned markets for new entry. Few (17%) expect to reduce the number of markets they serve.
Nearly all (91%) businesses serve domestic markets, with slightly higher participation in the southern U.S. and northeastern U.S. More than half operate internationally, with 42% deriving revenues from Canada and 31% operating in Europe. Some 45% expect to expand their reach across new areas of the U.S. and 27% plan to expand globally in the next two years.
Manufacturing practices
Approximately three-fourths of the respondents produce a physical product by way of manufacturing. Businesses that do not engage in manufacturing include about one-third of suppliers and one-third of design firms.
Machinery is typically owned as opposed to rented (95% owned/5% rented). Design firms are most likely to rent the equipment they need.
The age of machinery ranges from brand new (purchased in 2021) to more than 100 years old, but more than half of respondents have purchased new equipment in the last five years. Nearly 25 percent purchase new equipment “only when equipment is broken beyond repair.” Just over half plan to invest in capital equipment purchase(s) in the next two years.
Typically, inputs are sourced directly from the manufacturer (56%), though one-third (32%) are sourced through a distributor; the remainder are manufactured internally (12%).
Most report using a subcontractor sometimes, citing that the subcontractor has specialized equipment that is otherwise unavailable to them. About half serve as a subcontractor and a few do so regularly.
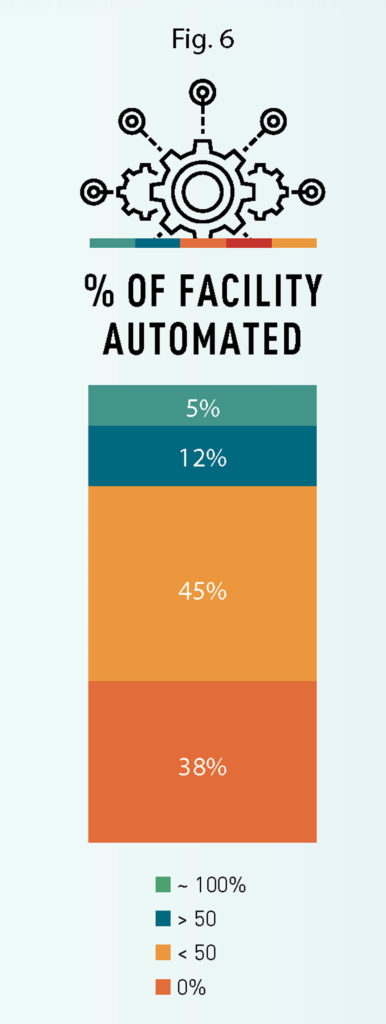
Most companies have implemented some automation, but few (17%) have automated more than half of their operations (Fig. 6). One-third plan to invest in automation in the next two years as part of their strategic growth plans. Automated cutting equipment followed by sewing capabilities are the equipment types and functions that are most under consideration. Among the third (38%) of companies that have not automated, many report that it is not a good fit for their primarily custom work. Others mention the lack of skilled labor to operate the equipment and the lack of perceived value derived from automation (e.g., the return on the investment isn’t enough to justify the cost of the automation equipment).
Top challenges
Despite the slowdown of the U.S. and world economies in 2020, businesses in the industry reported that their top challenge was finding skilled labor. More than half struggle to fill both full- and part-time positions (Fig. 7). In addition, problems caused by the pandemic including employees who lacked child care and employees needing to work from home were mentioned as top-of-mind challenges. Several specifically mentioned the lack of a trained workforce as a barrier to increased automation.
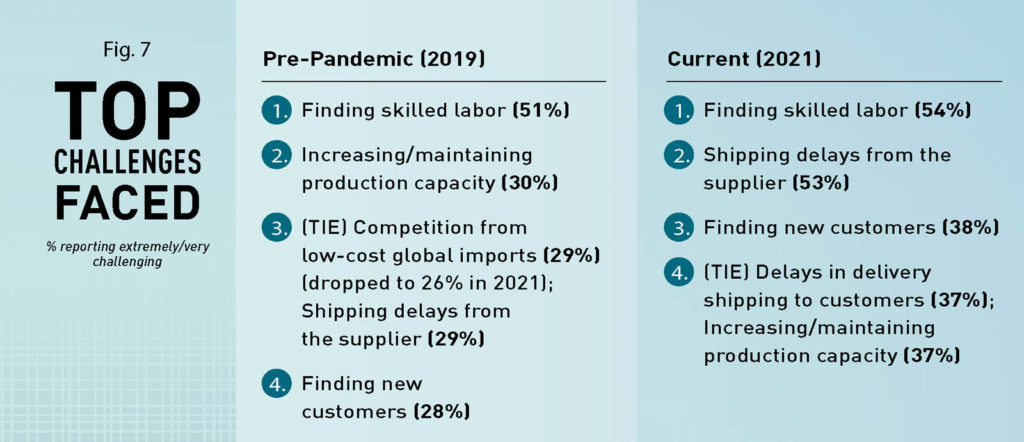
Another top challenge in 2020 was shipping delays from suppliers, which affected only 29% in 2019 but increased to 53% in 2020. Delays in deliveries to customers was also a top concern. On the positive side, the proportion of businesses facing competition from low-cost global imports decreased in 2020. It was the only challenge that was faced by fewer businesses in 2020 than in 2019.
Top trends
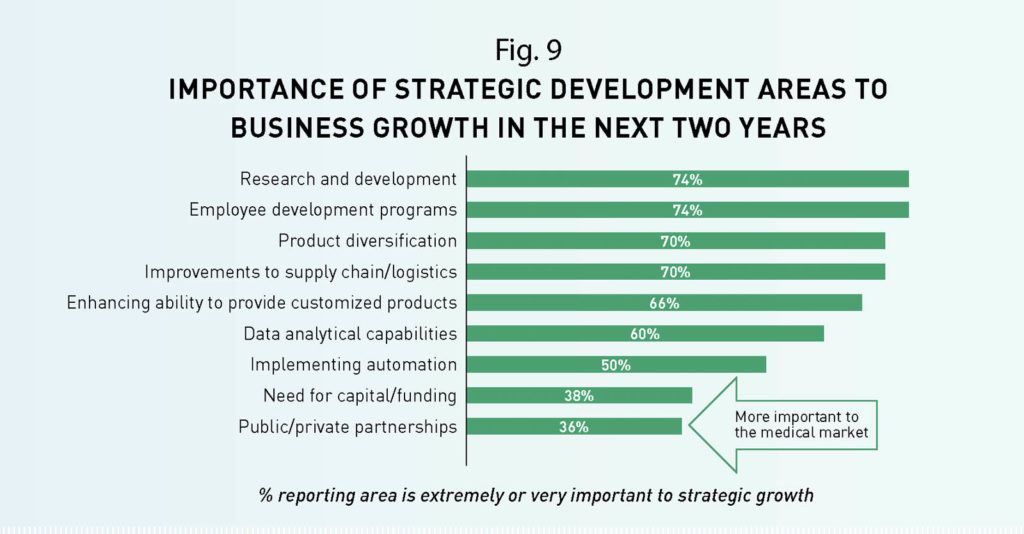
The most impactful trend mentioned was “new fabric technologies” (Fig. 8). Along the same lines, research and development was listed as most important to strategic plans (Fig. 9). This trend is most likely to affect those who serve the smart fabrics/e-textiles, consumer products and hospitality markets.
Following “new fabric trends,” increased demands for personalization and customization is considered impactful to 41% of businesses, most frequently to equipment manufacturers. That said, 85% of businesses already produce customized/personalized products. An average of 52% of revenue is derived from customized/personalized products. Two-thirds of organizations mention that enhancing their ability to provide customization/personalization will be important to their strategic growth.
Sustainability and environmentally friendly practices will affect 39% of respondents spread across all business types. Those who serve the mining market and the smart fabrics/e-textiles market will be most affected by this trend.
 TEXTILES.ORG


